The Fed raises rates another quarter-point… home prices rise for the fifth straight month … oil looks ready to break back above $80 … a huge inflation report this Friday
Today, the Federal Reserve followed through with its widely expected quarter-point interest rate hike.
The target Federal Funds Rate now sits at 5.25% – 5.50%, the highest it’s been since 2001.
Looking ahead, both the FOMC statement and Federal Reserve Chairman Jerome Powell were intentionally vague about the path forward.
From Powell in his press conference:
We will continue to make our decisions meeting-by-meeting based on the totality of the incoming data and their implications for the outlook for economic activity and inflation, as well as the balance of risks.
On many occasions, reporters tried to pin Powell down on various details or forward-looking estimates, yet he repeatedly evaded offering any real specifics.
Here are additional details from Powell’s press conference Q&A:
- The process of returning to 2% inflation “has a long way to go”
- Taming inflation will likely mean below trend growth and softer labor market conditions
- It is “certainly possible” to either hike again in September or pause
- Powell suggested we be careful in drawing too many conclusions from June’s cooler CPI reading and that it “was one good reading”
- Monetary policy is now “restrictive”
- Powell said we do “have a shot” at a soft landing and Fed staff is no longer forecasting a recession
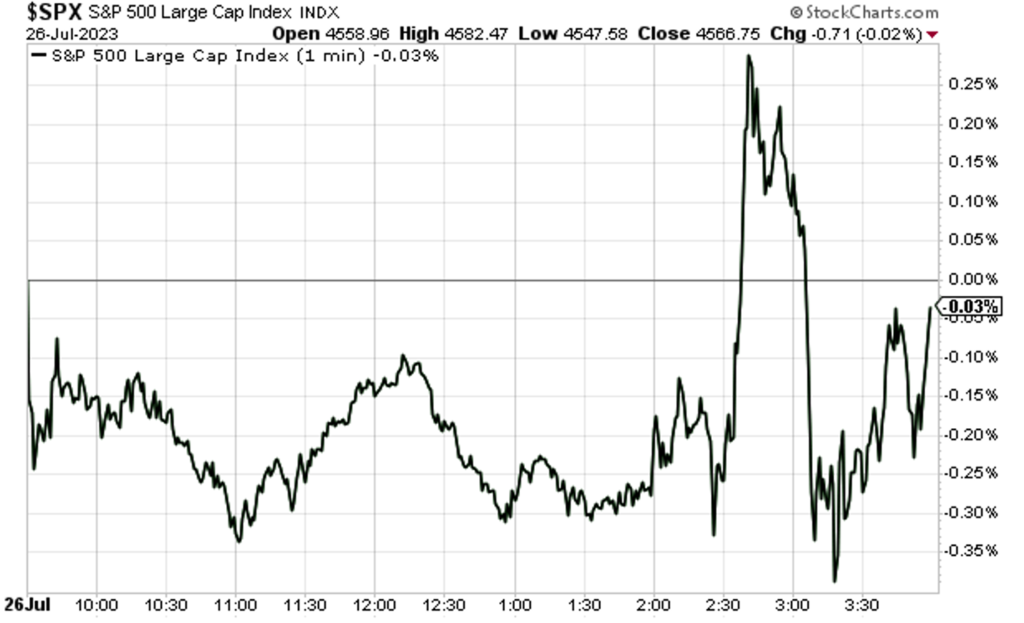
As to the market’s reaction, though stocks bounced around, there were no fireworks as nothing from today was truly surprising.
You can see below that the S&P stayed within 0.5% in both directions. Here’s a one-minute chart of the day:

As to the interest-rate path going forward, Wall Street is expecting cuts.
The latest data from the CME Group’s FedWatch Tool puts just 28.4% odds on December’s target rate remaining at today’s updated level of 5.25% – 5.50%.
Instead, the majority probability – 60.0% as I write – is that the Fed will have cut target rates back to 5.00% – 5.25% by this December.
Even after months of second-guessing the Fed and being wrong, Wall Street refuses to take the Fed at its word (Powell and Fed members have repeatedly said there will be no rates cuts this year).
With Powell’s emphasis so squarely on tracking the data when it comes to inflation, let’s look at two potential data challenges we might face later this fall
Inflation is dropping, yet home prices – the single largest component of the Consumer Price Index – continue rising.
Yesterday, we learned that home prices in May rose for the fifth straight month on the S&P CoreLogic Case-Shiller home price index.
Here’s more from CNBC:
Prices nationally rose 0.7% month to month, seasonally adjusted. The index’s 10-city composite gained 1.1%, and the 20-city composite gained 1%.
Prices nationally were still down 0.5% compared with May 2022, but they are just 1% below their June 2022 peak.
The housing market remains horribly out of balance. From a valuation perspective, as you can see below, home prices remain 38% more expensive than they were on January 1, 2020.
Also, as the CNBC article noted, with prices climbing again this year (despite the “new normal” of 7% mortgage rates), we’re now back to just a shade beneath all-time high prices.

Remember – shelter costs make up roughly one-third of the Consumer Price Index (CPI) and almost one-quarter of the Personal Consumption Expenditures Index (PCE).
Higher home prices are a significant upward influence on inflation. The potential tripwire for Wall Street is that we won’t see this in the data until later this year.
Watch out for the potential inflationary “pump fake”
Today’s “cooler” housing inflation data is benefitting from a time delay that will come back to bite us later this year.
From CNBC:
The CPI doesn’t capture [housing] price trends in real time.
It operates with a substantial lag, meaning it can take six months to a year for a decline (or increase) in current housing prices to fully feed through to inflation data, economists said.
This sets the stage for “current” housing data to appear cool, because we’re seeing the home price declines from last summer into the fall. Meanwhile, the coming data is set up to be hotter, complicating the Fed’s battle with inflation as we near the holiday season.
Here’s how Dallas Fed President Lorie Logan put it earlier this month:
The housing market even looks like it may have bottomed out. While housing inflation will likely continue to soften in the near term as a result of progress on rents last year, a rebound in housing would pose an upside risk to inflation down the road.
The risk for investors is that Wall Street isn’t adequately pricing this into stocks today as the market blazes higher. But if climbing home prices result in an unexpected uptick in inflation later this fall, prompting the Fed to action, watch out. With Wall Street now convincing themselves that hikes are over, a return to hikes would jar the market.
Here’s Torsten Slok, chief economist for Apollo Global Management:
If housing begins to recover more meaningfully, that raises the risk that inflation is going to be more sticky.
The real risk here is, meaning from a markets perspective, that the Fed has to step harder on the brakes.
This is something we’ll be keeping an eye on here in the Digest.
Meanwhile, housing isn’t the only upward pressure on inflation – oil is on the cusp of breaking above $80
We haven’t discussed oil in a while because there hasn’t been much to discuss. Oil’s price has languished since last summer. And here in 2023, the price of West Texas Intermediate Crude (WTIC) has dipped into the upper $60s on five different occasions.
But WTIC appears likely to climb back into the $80s (it trades at $79 as I write Wednesday). And while that could be a problem for inflation, legendary investor Louis Navellier sees a particular group of stocks making a lot of money from it.
From yesterday’s Flash Alert podcast from Growth Investor:
Crude oil prices crossed about the 200-day moving average. There’s a variety of reasons for that.
One is China has imported more oil this year than they did last year. And they are stockpiling oil…
The second thing that’s going on is the amount of oil that’s leaving the west coast of Russia to be shipped around the world is now at a seven-month low. So, that has supply a little bit tight.
Of course, the Saudis have their two-million-barrel-per-day cut.
And Mexico, which is obviously a big producer for North America, did have a pretty horrible fire on one of their rigs and one of their refineries.
So, the supply of refined product is very, very tight. That means refiners are going to make a lot of money.
On one hand, there is an opportunity to invest in some of top refiners by capacity. That list includes Exxon, Valero, Marathon, Shell, and Phillips 66. Louis has been leading his Growth Investor subscribers to big profits with his oil plays over the last year – you can learn more as a subscriber by clicking here.
On the other hand, be aware of what sustained, higher oil prices could mean for the Fed, inflation, and rate policy later this fall.
While seasonality suggests that oil prices should ease in the fall, if the challenges to supply we just referenced remain, it will continue to apply upward pressure to oil prices even if demand slightly eases.
Bottom line: Inflation is highly dynamic, and we should be cautious about declaring victory over it today.
Continuing with inflation, Friday brings a huge report that will greatly influence the Fed’s upcoming policy direction
The Fed’s preferred measure of inflation is the Personal Consumption Expenditures (PCE) price index, and on Friday, we’ll get the latest data.
As we’ve pointed out here in the Digest, while the CPI and many other metrics have shown significant progress on inflation over the last year, the PCE’s data haven’t been as encouraging.
Below, you can see the latest Core PCE numbers coming in only slightly below their November 2021 level.

Since the Fed considers Core PCE to be the most accurate reflection of inflation, its stubbornly high levels have been a major reason why the Fed has remained on the gas pedal in recent months.
But if Friday’s PCE numbers show substantial cooling, we can breathe easier about this bull market since the Fed will be breathing easier about inflation. So, we would expect a cool PCE print to be a major shot in the arm for stocks.
Speaking of stock prices, one last thing to watch
Want to know where this market goes next?
Watch the U.S. dollar.
A weak dollar tends to be good for the stock market, with the inverse also broadly true too. The chart below, comparing the performance of the S&P (in green) and the U.S. Dollar Index (in black) over the last year, illustrates this striking, inverse relationship.

So, will a falling dollar continue to be a tailwind for stock prices?
Well, that depends – are you a contrarian or do you believe analysts get it right?
From Bloomberg, a few days ago:
Asset managers boosted bearish dollar bets to a record amid speculation slowing US inflation will hasten the end of the Federal Reserve’s 16-month run of policy tightening.
On one hand, these asset managers are smart – and they have an army of number-crunching analysts behind them.
On the other hand, a study of market history finds that when everyone is convinced a certain dynamic is going to play out, the opposite often happens.
This is a big one to watch. We’ll keep you updated.
Have a good evening,
Jeff Remsburg


