When stocks rally on seemingly bad news, that usually means good news – and a huge rally – is on the horizon. And that’s exactly what we’re seeing today following the release of August inflation data.
The ultra-important inflation report hit the tape this morning, and it was a bit hotter than expected. The consumer price index (CPI) rose 3.7% year-over-year last month, up from 3.2% in July and more than the 3.6% rise anticipated by Wall Street.
Over the past 18 months, we’ve seen hotter-than-expected inflation reports typically cause stock market crashes.
But that’s not happening today.
Instead, stocks are rallying.
Why?
We think there are five major reasons for this price action. And all underscore that today’s inflation report could mark a significant turning point for the stock market – and signify the start of a huge year-end rally in stocks.
Why Stocks Are Rallying Despite Hot Inflation Data
#1: Oil Prices Are to Blame for Any Reinflation
Inflation picked back up in August solely because of oil; everything else continued to deflate.
In August, headline CPI rose from 3.2% to 3.7%. But that reinflation was driven entirely by rising oil prices.
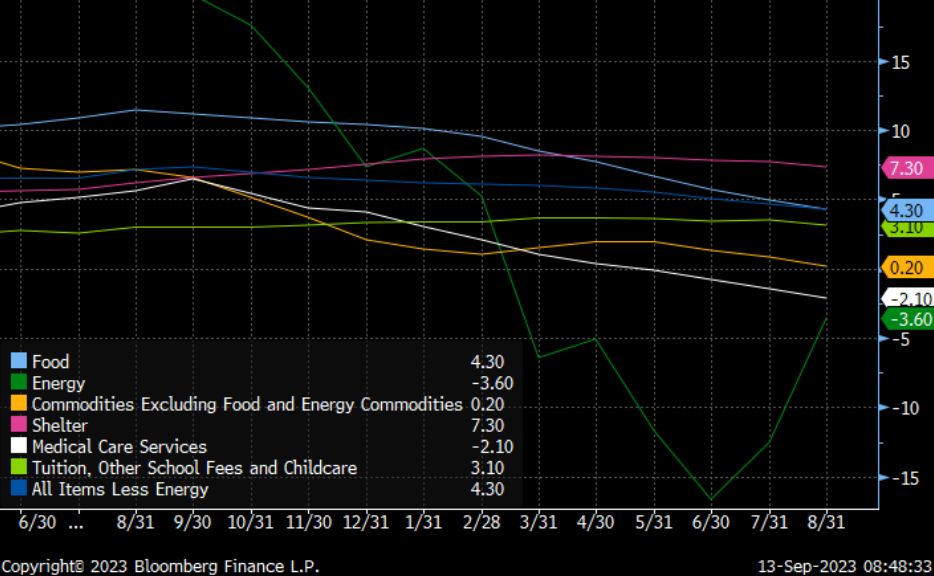
Energy CPI reinflated last month, rising from a 12.5% drop in July to just a 3.6% drop in August. And that was pretty much the only line item in the CPI report that reinflated last month. Food CPI dropped from 4.9% to 4.3%. Apparel CPI fell. So did furniture and new and used cars CPI. Shelter CPI dropped from 7.7% to 7.3%, while medical care CPI slid from -1.5% to -2.1%. And education CPI fell from 3.5% to 3.1%.
Indeed, when you remove energy from this equation, August’s CPI dropped by 40 basis points to a new cycle-low of 4.3%. And that’s what matters.
The Fed doesn’t control oil prices, especially not when the Saudis are just cutting production. Plus, oil prices are especially volatile. The Fed won’t benchmark policy to uncontrollable and volatile energy prices. It’ll benchmark policy to everything else – and everything else experienced meaningful disinflation last month.
#2: Inflation Has Nearly Reached the Fed’s Target Level
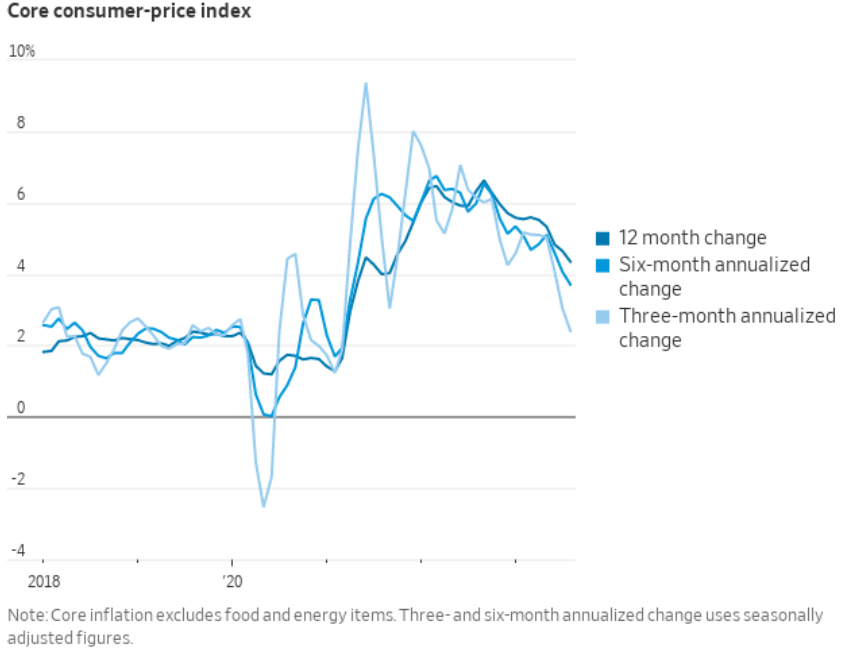
The Fed’s preferred inflation metric – instantaneous core inflation – dropped to just 2.4% last month. That’s just a stone’s throw away from its 2% target.
The Fed is focused on core inflation. That’s what it controls and what it’s benchmarking policy against. And no matter which way you slice it, core inflation is crashing.
In August, the 12-month core inflation rate dropped to 4.3%, while the six-month annualized core rate dropped to 3.7%. And the most instantaneous measure of core inflation – the three-month annualized core CPI rate – dropped to just 2.4%. That means instantaneous core inflation is running just above target. And that’s very bullish for stocks because it means the Fed is done hiking rates.
#3: Shelter Inflation Is About to Plummet
The all-important shelter inflation rate saw its biggest drop yet in August. And leading indicators suggest it will crash over the next 12 months.
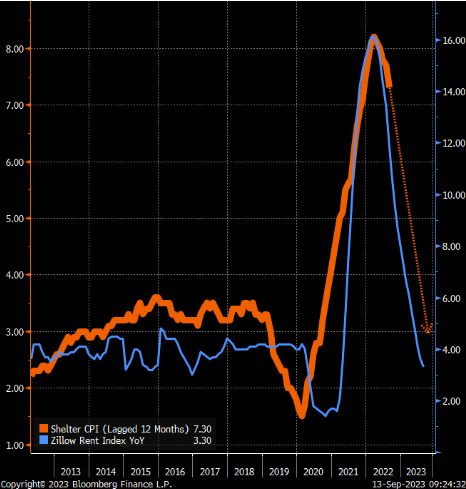
The biggest component of inflation is shelter. Indeed, shelter CPI accounts for about 35% of overall CPI. And given stubbornly high rent and home prices, it has proven to be very sticky over the past 12 months. But rents across the country are starting to drop pretty quickly. And as a result, shelter CPI is now falling, too.
Last month, shelter CPI had its biggest drop in years, falling from 7.7% to 7.3%. But here’s the real kicker: shelter inflation should keep dropping rapidly over the next 12 months. It’s a lagging indicator. Specifically, it tends to lag Zillow’s Rent Index by about 12 months – and that index has been plunging for the past year. Of course, this implies that shelter CPI is set to crash over the next 12 months. And that’s very bullish.
#4: The Disinflation Trend Continues
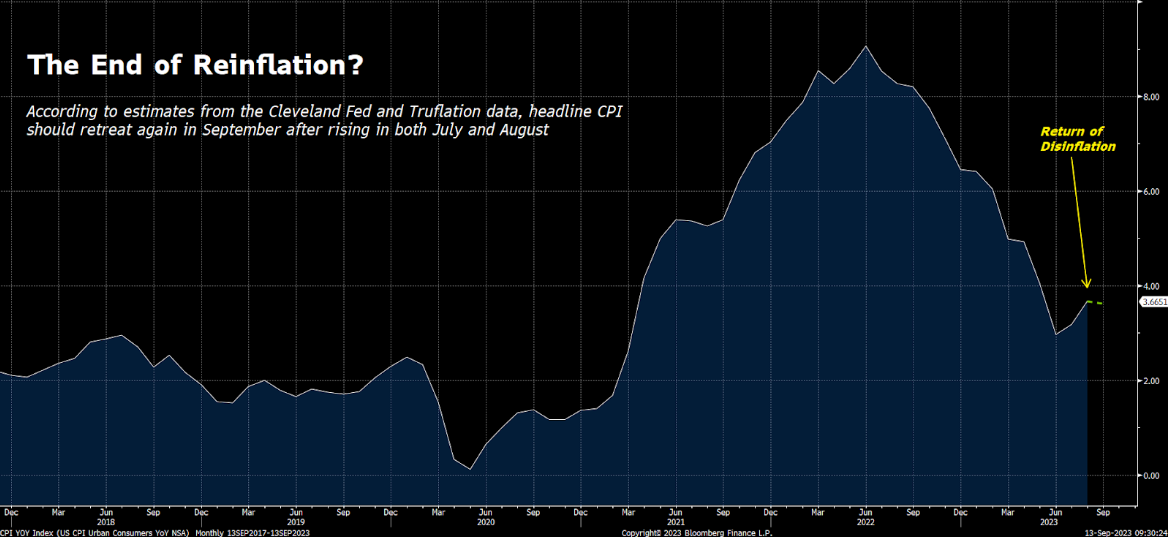
Today’s data was likely the last of the “reinflation reports,” and the disinflation trend should return in September.
The market hit some turbulence in August and September. And that’s because the disinflation trend that powered stocks higher through the first seven months of the year suddenly stopped. For the past two months, headline inflation rates – which had dropped over the prior 12 months – have been rising. But that reinflation likely ended with this most recent report.
Current estimates (based on the Cleveland Fed’s Nowcast model and Truflation data) call for inflation rates to start falling again in September. The reinflation blip is over. The disinflation trend is back. That’s huge for stocks.
#5: Rate Hikes Are Over
Odds for another Fed rate hike shifted dovish after August’s inflation report hit the tape.
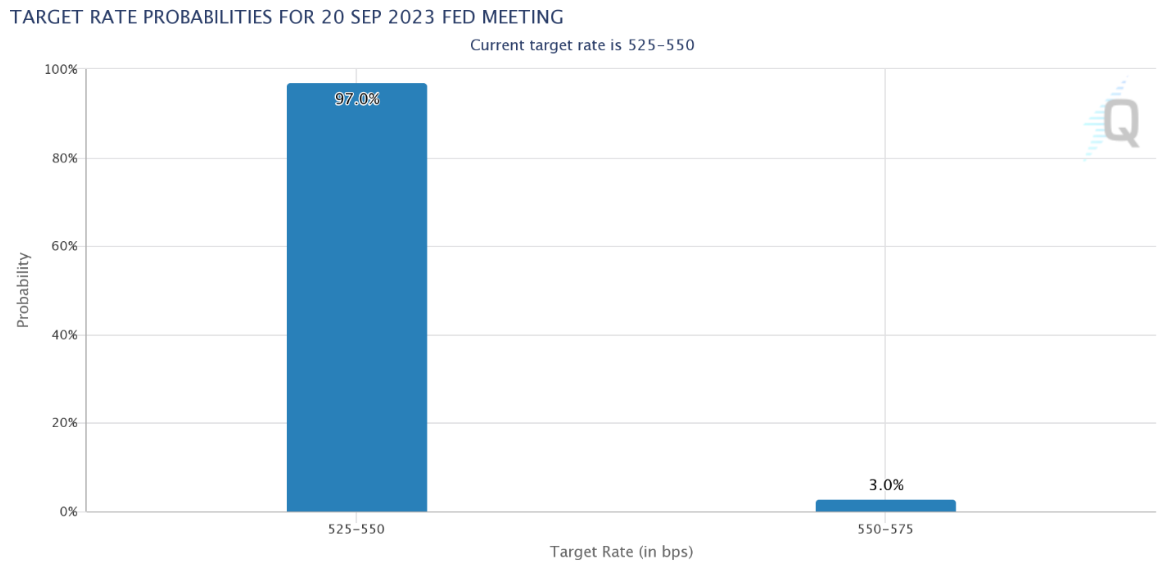
Usually, after a hotter-than-expected inflation report, the futures market starts pricing in more Fed rate hikes – but not today. After this morning’s inflation report was released, market pricing on Fed rate-hike odds actually shifted dovish. Odds for a September rate hike dropped from 8% to just 3%. November rate-hike odds slid from 42% to 38%. And odds for rate cuts in 2024 rose, too.
It seems the market sees what we see: This was the last of the reinflation reports, and the Fed is done with rate hikes.
The Final Word
Overall, August’s inflation data was actually really bullish for the equity markets – and it could mark a critical turning point for stocks.
Yes, stocks have been choppy and volatile since late July. But we think this inflation report sets stocks up nicely for a massive year-end rally.
And we have the perfect system to help you prepare for that rally.
Just last night, we unveiled our new, state-of-the-art AI-powered trading system, Prometheus.
Prometheus was trained on hundreds of thousands of financial market data points, with the sole purpose of pinpointing when a stock is about to surge higher.
That is, this next-gen AI scans the entire stock market every week to gauge the probability that a given stock will surge higher in price over the next month.
All you have to do is ask Prometheus about a stock, and it’ll give you a score.
The higher the score, the more likely the stock is to surge over the next month. The lower the score, the less likely.
Forget the guesswork and uncertainty surrounding investing. Prometheus provides answers.
That’s an absolute game-changer for anyone with money in the markets.
Imagine knowing, with a quantified measure of certainty, that a stock is either going to go up significantly or down significantly over the next few weeks.
I’m sure it would make a world of difference for your investment strategy. It certainly has for us.
A few weeks ago, we started using this AI in real time. And it helped us find one stock that has popped more than 50% in just a week!
Just two days ago, Prometheus signaled a super-strong Buy Alert on a tiny stock that has… wait for it… already popped 30%. Just two days.
Point being: Prometheus works. It is an absolute game-changer. And last night, we unveiled this AI for the very first time.
If you missed the event – no worries. We have a replay for you right here.
On the date of publication, Luke Lango did not have (either directly or indirectly) any positions in the securities mentioned in this article.


