“No signs of a recession” … actually, there are abundant signs of a recession … but “stay invested” is the right call … how to balance the tension
The bottom line is that the US economy is not in a recession, and there are no signs of a recession on the horizon.
So says Torsten Sløk, Chief Economist at the research shop Apollo.
He didn’t pull that conclusion out of thin air. He presented 10 points with charts supporting his takeaway.
For example, weekly retail sales are up… wage growth accelerated in August… jobless claims are down in recent weeks… and GDP forecasts are reasonably strong. He makes some solid points, and we’d be wise to consider them.
Still…
There are no signs of a recession?
Not a single one?
I lean cautious today, as I have for months. Not because I’m a permabear who wants to see a market selloff, but because a study of the most successful investors of all time reveals that a continual focus on “defense” is the best way to achieve the long-term returns we all want.
Here are just a handful of world-class investors expressing this sentiment…
- Paul Tudor Jones: “Don’t focus on making money; focus on protecting what you have.”
- Benjamin Graham: “The essence of investment management is the management of risks, not the management of returns.”
- Charles Ellis: “If you avoid large losses with a strong defense, the winnings will have every opportunity to take care of themselves.”
- David Dreman: “History constantly demonstrates that investors are prone to adhere to the dictates of greed and fear. The way to wealth is not just to make money, but to avoid loss.”
- Seth Klarman: “The best investors…focus first on risk, and only then decide whether the projected return justifies taking each particular risk.”
From this lens, a persistent focus on “what could go wrong” isn’t intended to be a laundry list of reasons to stay out of the market; it’s a framework that shapes how, and to what extent, we’ll remain in the market.
But this requires objective analysis about the risks. Not a “no signs of a recession” victory lap.
So, what signs of a potential recession do exist today?
Let’s start by going straight to our jobs market.
Here’s analyst Charlie Bilello:
The spread between Job Openings and Unemployment Persons in the US has moved down to 510k. That’s the smallest differential since April 2021, down from a peak of over 6 million in March 2022.
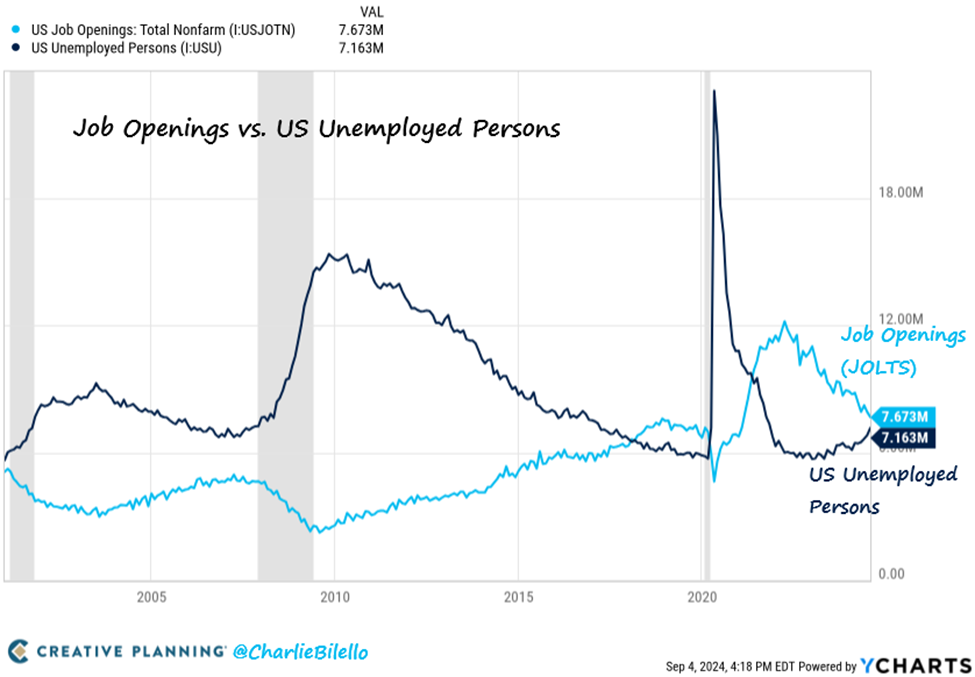
Now, look at the chart again. On the far left, you’ll see a gray shaded bar indicating a recession. Note how this recession was preceded by the blue JOLTS line and the black unemployment line growing very narrow.
A similar narrowing also preceded the 2008/2009 recession. However, in 2018, we saw another narrowing, though there was no official recession (though there was an economic slowdown and stock market fireworks).
Clearly, this narrow spread doesn’t guarantee a recession, but isn’t this something to consider?
If the answer is “no,” then what about corporate hiring plans? And/or job cuts?
Here’s the recruiting firm Challenger, Gray & Christmas:
U.S.-based employers announced 75,891 cuts in August, a 193% increase from the 25,885 cuts announced one month prior. It is up 1% from the 75,151 cuts announced in the same month in 2023…
U.S. employers have announced 79,697 hiring plans, down 41% from the 135,980 plans recorded through August last year. The year-to-date total is the lowest since Challenger began tracking in 2005.
The previous lowest total through August occurred in 2008, when 80,387 hiring plans were announced.
Still no signs of a possible recession?
Okay, well, forget jobs, let’s look at the state of U.S. manufacturing
Here’s MarketWatch from last week:
A key barometer of U.S. factories was negative for the fifth straight month, signaling the manufacturing side of the economy is still in a deep slump that might not end until after the presidential election.
The Institute for Supply Management’s manufacturing index edged up to 47.2% from an eight-month low of 46.8%. Numbers below 50% signal the manufacturing sector is shrinking.
Meanwhile, the index of new orders fell to its lowest level in more than two years. And the production barometer dipped 1.1 points, which is the lowest level since the economy shut down in May 2020.
And here’s related longer-term data and context from Bilello:
The ISM Manufacturing PMI has been below 50 (in contraction) for 21 out of the last 22 months. With data going back to 1948, that’s only happened one other time: 1989-91 (Recession occurred in 1990-91).

But I’m sure this too is nothing, so let’s move on…
Switching to U.S. bankruptcies…
Here’s Investment Executive from Monday:
U.S. corporate bankruptcy filings surged in August, according to S&P Global Market Intelligence.
The rating agency reported that 63 corporate bankruptcies were filed in the month, up from 49 in July, pushing the total through the first eight months of the year to 452 filings.
By comparison, there were 466 bankruptcies in the first eight months of 2020, when companies were grappling with the effects of the onset of the pandemic, S&P noted.
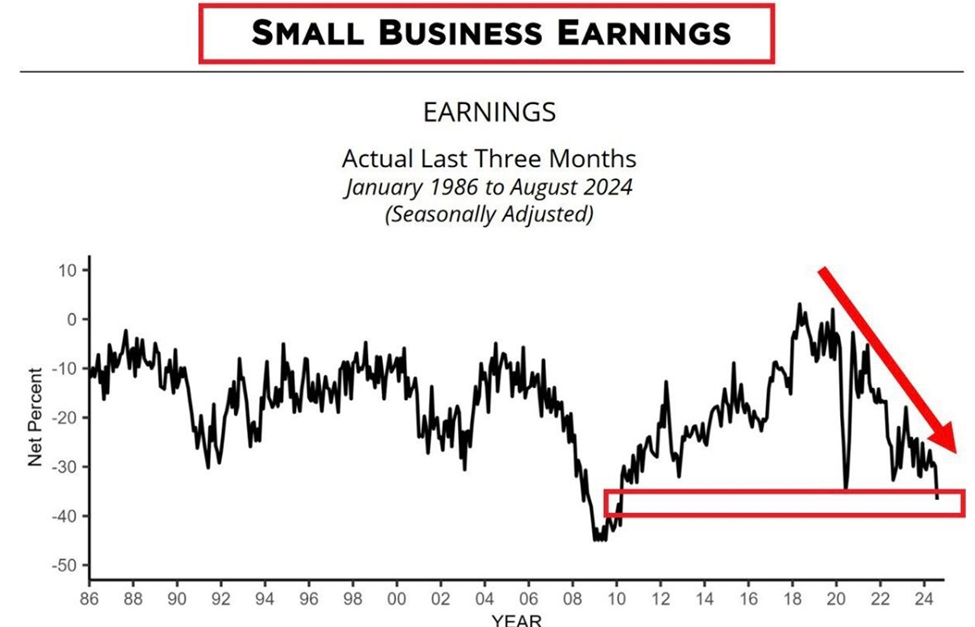
The financial condition of small- and mid-sized businesses helps explain some of the bankruptcies. In the chart below dating back nearly 40 years, you can see seasonally-adjusted small business earnings have been falling hard since 2020, and are now nearly as low as those back in 2009.
Then, last month, the Conference Board Leading Economic Index (LEI) decreased to its lowest level since April 2020. That marked its fifth consecutive monthly decline.
That said, an article from Advisor Perspectives covering this story carried the titled “CB Leading Economic Index: Continues to Fall…But No Recession Signal.”
That’s true. There was no official recession signal. But might five consecutive months of declines be pointing toward an elevated risk of triggering a recession signal?
We’ll quickly blow through a few more to keep this from dragging out…
One, the inverted yield curve has finally normalized after its longest inversion ever. Historically, this has been a mostly reliable indicator of a recession, though countless articles have explained why “this time is different.”
Two, oil prices are trading in the mid-$60s, reflective of languishing economic demand. Here’s CNBC from Monday:
After last week’s steep sell-off, oil prices suggest traders are pricing in a demand slowdown that is similar to a mild recession, according to a Morgan Stanley analysis.
Three, the Sahm Rule – one of the most accurate recession indicators we have – triggered in July. Here again, it was met with a chorus of “this time is different” (including Claudia Sahm herself!).
Four, one of the pushbacks to the latest triggering of the Sahm Rule is that it reflects not firings, but a growing number of people looking for work. To adjust for this, researchers Pascal Michaillat and Emmanuel Saez published amendments to the Sahm Rule (called the Sahm Rule+) to consider demand for labor via job openings.
Their conclusion? The economy is in “possible recession” territory. Current levels are consistent with every recession since 1960.
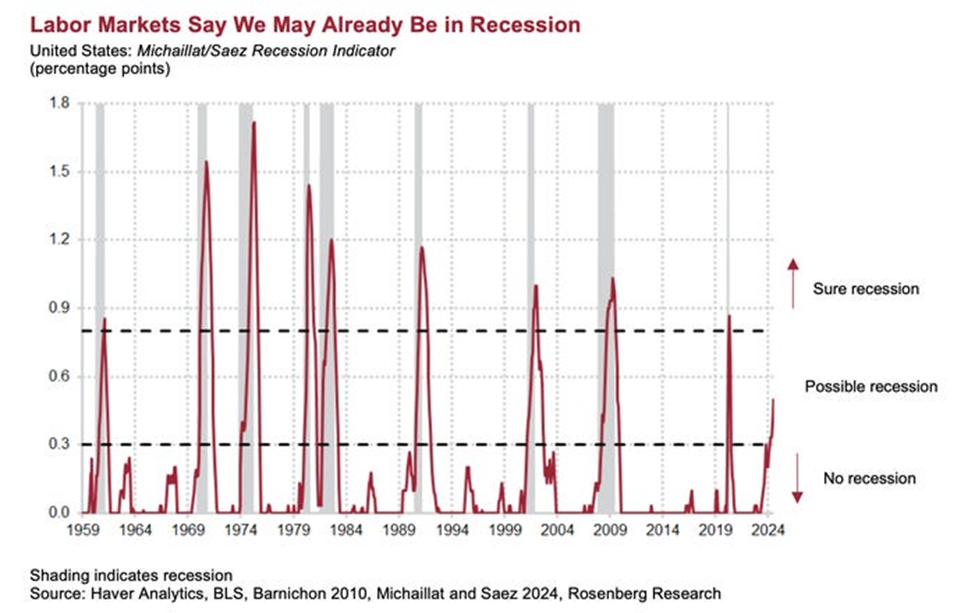
I’m guessing someone will find a reason to conclude that this time is different too.
Now, it could be. This time could be different.
But we’d be wise to remember Sir John Templeton’s famous saying, “The four most dangerous words in investing are, ‘it’s different this time.’”
What our analysis does – and does not – mean
None of the data we’ve presented today guarantees we’re in for a recession. We could absolutely have a soft landing, and I hope we do.
However, our analysis does suggest that the idea “there are no signs of a recession on the horizon” is a headscratcher. There are abundant signs of a possible recession.
But this doesn’t mean we give up on the market.
Earlier, we referenced a series of quotes from experts about the necessity of focusing on what can go wrong. But too much focus on caution is just as dangerous as not enough.
Two quotes on this:
Mellody Hobson: “The biggest risk of all is not taking one.”
Robert G. Allen: “How many millionaires do you know who have become wealthy by investing in savings accounts? I rest my case.”
So, how do we navigate the tension between “not enough risk” and “too much risk”?
Simple – by dialing up and down our exposure and being intentional about where we want exposure.
Investing shouldn’t be a binary decision where you’re either in or out, like a light switch.
It’s more of a dimmer knob in which you gradually add more or less exposure, fine-tuning your risk level to reflect your specific investment temperament and goals.
Yes, I’m cautious, but let me be clear: you want to be in today’s market.
The data surrounding historical stock market performance in the wake of interest rate cuts is too compelling.
But…
You want to be in this market with your eyes wide open and your risk mitigation strategies clearly defined. There are too many wildcard issues that could derail our bull market – and your portfolio if you’re overexposed.
So, if you haven’t already done so, take a few minutes today…
How much market exposure do you want to today’s market based on your investment goals, your time until retirement, and your risk tolerance?
Where do you want your exposure coming from, exactly (think sectors, trends, asset classes…)?
For example, do you want more money allocated to the AI sector to benefit from a long-legs trend? Small caps to benefit from the Fed’s impending interest rate cuts? Gold to benefit from our government’s unstable financial conditions?
Looking ahead, what will prompt you to put more money into this market, or pull more money out?
Questions like these will help you fine-tune your market approach and get you closer to achieving your investment goals – without losing sleep at night.
So, are there signs of a recession on the horizon?
Of course there are.
But there are plenty of signs of a strengthening bull market too.
The only question is what’s the best setting for your personal investment “dimmer knob” to balance these two possibilities?
On the topic of “strengthening bull market,” last night, Luke Lango made a powerful case for why you want exposure to today’s market – specifically, top-tier AI plays
We’re running long so I won’t get into the details. But you can watch a free replay of the event right here.
I’ll only add that Luke is comparing today’s market to bullish conditions in1995, 1998, and 2019. This is definitely a perspective you need to factor into your portfolio positioning today.
Have a good evening,
Jeff Remsburg


