The inverted yield curve normalizes … what it means for recession timing … how stocks perform in a recession … volatility is your friend
So, are we going to get a recession or not?
As we noted in yesterday’s Digest, the longest-running inverted yield curve in history officially returned to normal yesterday.
In this case, “normal” is the zero line (or a positive reading).
Although that sounds like a good thing, such normalizations have often served as a “final countdown” for an ensuing recession.
Of course, a recession isn’t guaranteed. And let’s not forget how many on Wall Street spent much of late 2022 wrongly predicting a recession (including me).
Here’s a headline reminder from CNBC:

Plus, even if a recession is to occur, that would serve as its own starting gun toward a period of fantastic stock market performance.
Let’s walk through all the details here so we can be mentally prepared for whatever is on the way.
Yield curve inversion 101
To make sure we’re all on the same page, a yield curve is a graphical representation of the yields of all currently available bonds, from short-term to long-term.
In normal times, the longer you tie up your money in a bond, the higher the yield you would demand for it. So, you’d expect less yield from a 2-year note and more yield from a 10-year note.
Given this, in healthy market conditions, we usually see a “lower left” to “upper right” yield curve. But when economic conditions become murky and investors aren’t sure what’s on the way, the yield curve tends to flatten.
And if the curve inverts, history has shown that it is a highly accurate predictor of recessions, though the timing of those recessions varies. From Reuters:
Yield curve inversion is a classic signal of a looming recession.
The U.S. curve has inverted [6 to 24 months] before each recession in the past 50 years. It offered a false signal just once in that time.
The most widely watched yield curve inversion involves the 10-year and 2-year Treasury notes. Until yesterday, this part of the yield curve had been inverted for more than two years.
If that seems like a long time, it is. Back in March, the inversion set a record for the longest continuous inversion of the U.S. 2s and 10s.
But while the term “inverted yield curve” has turned into an investment boogeyman, the real threat isn’t the inversion, it’s the period after the inversion normalizes.
Let’s return to one of our Digests from last October:
Using data from the Federal Reserve, let’s go back to the mid-70s and look at the timing of when inverted yield curves normalized and ensuing recessions.
In the chart below, we have the 10-2 spread. We also have recessions that are marked by shaded gray areas.
We’ve added a black dotted line to the 0% level to help you see inversions more clearly.
Note that this normalization of an inverted yield curve has preceded each recession except those in the early 1980s when the recessions began during the inversions.
(We’re ignoring the 2020 recession because there wasn’t a sustained yield curve inversion.)

As you can see, since the mid-1970s, there is no example of an inverted yield curve normalizing that did not result in a recession.
If history repeats and we’re in for a recession, when might it begin?
Before we answer that, let’s clarify something…
Remember the old philosophical question “If a tree falls in a forest and no one is around to hear it, does it make a sound?”
The recent economic equivalent is “If the economy suffers a recession yet the government refuses to call it a recession, does Main Street really endure hardship?”
You may recall 2022 when the U.S. economy suffered two consecutive quarters of contractions: a 1.6% decline in Q1 2022 followed by a 0.9% slowdown in Q2. This met the traditional definition of recession used by economists for decades. However, many of our politicians and appointed officials refused to call it that.
For example, Treasury Secretary Janet Yellen preferred the happy talk that our economy was in a “state of transition.”
Here’s how a user on X poked fun of that comment:

Given this, let’s put a little space between our analysis and an official “recession.” After all, the term is somewhat pointless anyway. If GDP comes in a 0.01% followed by 0.01%, that’s not an official recession, but you can be sure that loads of Americans would be out of jobs and struggling to make ends meeting in such an environment.
So, whether our government is willing to admit an official recession or not, let’s look at when the economic pain typically intensifies in the wake of an inverted yield curve normalizing.
The lag time between normalization and a recession (or a “state of transition”)
There are no hard-and-fast rules, but if we evaluate the prior 30 years, we’re looking at somewhere between six months and a year-and-a-half. Given the record length of the inversion this time around, the lag time could be shorter…or longer. No one truly knows.
In June 2007, the inverted yield curve normalized, and the Great Recession officially began six months later in December of 2007.
In January of 2020, the yield curve normalized, and the ensuing recession began in March of 2021, about 14 months later.
If we go all the way back to 1988, the yield curve normalized in December, then about 19 months later, we entered the recession.
But a couple of points to consider…
First, the investment pain doesn’t wait until the powers that be officially declare “recession.” You stock market history buffs know that stocks usually begin taking it on the chin well before an official recession began.
This makes sense for a couple reasons…
First, remember the reason why the Federal Reserve usually chooses to cut rates (which helps normalize the yield curve): fears of a recession.
Unfortunately, history shows that all too often, the Fed is late to the game. So, its rate cuts don’t stop a recession, they simply trumpet its forthcoming arrival.
On that note, almost on cue when the yield curve normalized yesterday, Atlanta Federal Reserve President Raphael Bostic said:
We cannot wait until inflation has actually fallen all the way to 2 percent to begin removing restriction because that would risk labor market disruptions that could inflict unnecessary pain and suffering.
You don’t say?
And just this morning, the ADP jobs report showed that private sector payrolls grew at the slowest pace in almost four years and was well below estimates. The Dow Jones consensus forecast was 140,000 but the actual number came in at just 99,000.
Also this morning, the jobs placement company Challenger, Gray & Christmas reported that this was the worst August for layoffs since 2009.
Not good.
Second, it makes sense that stocks would begin pulling back before an official recession because Wall Street always looks ahead.
Even though Wall Street and the economy loosely mirror one another, they rise and fall on different timetables, with Wall Street leading the way.
Here’s a crude illustration with stocks in green, frontrunning the economy in black.

So, if this time is not different, and the normalization of the inverted yield curve means we’re on a path toward: 1) stocks falling followed by 2) the economy contracting, what should we expect?
Short-term pain followed by long-term gain
Let’s look at this from two perspectives: a long-term buy and hold investor, and a short-term opportunistic trader.
For the long-term investor, recessions aren’t fun – but only during the first part of the recession. In the later stages, they’re a blast since Wall Street leads the recovery.
Below are data from Schroders by way of analyst Callum Thomas. If you’re having trouble seeing it, the first six months of a recession typically bring market declines of between 15% and 20%.
But the final three months of a recession bring gains of around 12%.
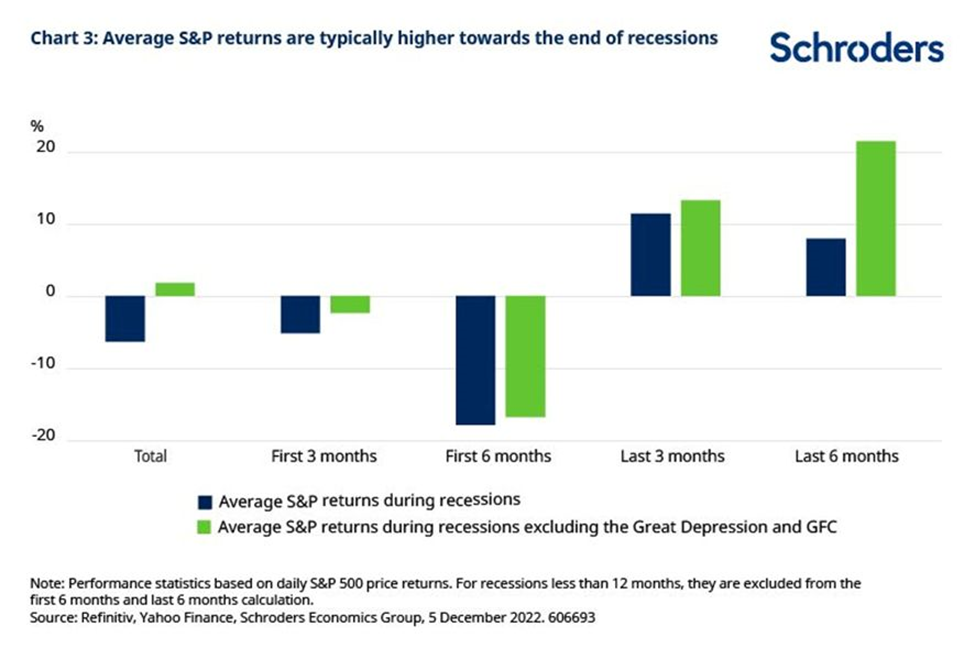
And how far into a recession do stocks reach their inflection point between pain and gain?
In a report published in 2022, Goldman Sachs suggested that the low point in the stock market usually comes three to six months before the economy’s low-water mark.
For long-term investors, this means a couple things:
One, brace for the potential for a pullback in your favorite core holdings, but don’t let that scare you; two, clear up your cash so you can add to your positions in a handful of months if/when the market might be hitting its low (before the economy officially turns).
For traders, the takeaway is different: “get excited!”
For traders who know how to profit in both bull and bear markets, impending recessions are welcomed. After all, they can result in huge spikes in volatility which knowledgeable traders can profit from.
Our own Jonathan Rose is one such “knowledgeable trader.”
For newer Digest readers, Jonathan was a professional trader for over 16 years prior to joining our corporate family earlier this year. He traded in the “pits” of some of the biggest exchanges in the world – including the Chicago Mercantile Exchange and the Chicago Board Options Exchange.
One of Jonathan’s favorite ways to trade centers on volatility and how it impacts option pricing. While that might sound confusing, it’s rather simple.
In short, Jonathan looks for inconsistencies between the potential for heightened market volatility and how options are priced. When he finds an especially large inconsistency, that get his attention – and many times, results in a winning trade.
On that note, a quick word of “congratulations” for Jonathan’s Advanced Noticed subscribers.
In the first three months of the service’s existence, it has already closed out five different recommendations that rose at least 100%, including:
- A 100% gain in seven days on Upstart Holdings…
- A 102% gain less than a month on ING group…
- A 126% gain in nine days on Penn Entertainment…
- A 245% gain in 25 days on Criteo, and…
- A 463% gain in 13 days on C3.ai.
We had high hopes for Jonathan when he joined our corporate family, and he’s certainly not disappointing. Again, congrats to all the Advanced Noticed subscribers on these wins.
But more important for you reading this is recognizing that this style of trading doesn’t require stocks to be bullish
If you’re worried about a recession and a bear market, no problem. This type of trading doesn’t need a bull market. Frankly, it doesn’t even need you to be right about the direction a stock is going to move…being right about a pricing imbalance is far more important.
To this end, Jonthan will often recommend buying two positions – one bullish, one bearish. This way, he’s covered regardless.
While it might seem hard to profit this way, when the ensuing move is big enough, the absolute dollars you make on the winning side of your trade can dwarf the dollars lost on the losing side.
Below is an example from earlier this year on Jonathan’s Pure Storage Inc (PSTG) trade.
As you’ll see, though one side of this trade lost everything, the net gain on the entire trade was almost 200% thanks to the 474% winning position.

If you’d like to learn more about how it all works, Jonathan has put together an introductory video that you can check out here.
In any case, just note that you can make a great deal of money even in a bearish market.
So, are we headed for a recession or not?
Let’s rephrase …
Are we headed for further economic weakening or not?
Most likely, yes.
We’ll get more color on this in tomorrow’s jobs report. This is a big one, having the potential to move the market.
But even if economic weakness materializes and some degree of exaggerated market pullback is in our future, that doesn’t need to cause alarm. As we’ve been stressing in the Digest for months, having a detailed investment plan prevents kneejerk, fear-based market decisions. After all, you’ll know exactly what to do…
At the most basic, you’ll either ignore volatility, holding fast to your top-tier anchor holdings, and looking for opportunities to add to those positions at lower prices…
Or you’ll trade heightened volatility for profits, while recognizing and following the stop losses in your more speculative holdings.
Either way, with a little preparation, a recession/bear market can be far less “threat,” and far more “opportunity.”
Have a good evening,
Jeff Remsburg


