


No $100 oil coming soon … but is a rebound coming in Q4? … the contrarian case based on extreme pessimism … long-term tailwinds blowing … attractive Big Oil valuations
Don’t expect $100-per-barrel oil anytime soon.
Last week, the world’s top crude exporter, Saudi Arabia, reported it will give up its $100 price target as it prepares to raise crude output in December. This will add to what is already a glut of supply relative to demand. This comes at a time when the price of West Texas Intermediate Crude is trading in the upper-$60s.
So, is the oil patch toxic then? Nothing to do here but ride out the weakness until…well, until what exactly? Is there a bullish case to be made?
Yep. The only question is when it will arrive, and how early you want to jump in.
Will the real oil demand please stand up?
Let’s begin our analysis by looking at oil’s prospects for the rest of the year.
Since topping out just under $94 a barrel last fall, prices have been dropping for one basic reason: too much supply relative to too little demand.

So, with OPEC on the verge of adding even more supply to this imbalance, higher prices will only materialize if demand roars higher. Is there a reason to believe that this will happen between now and the new year?
Well, with interest rates falling here in the U.S., the hope and expectation is this will goose economic activity. However, given the lag between the timing of rate cuts and when they’re felt in the economy, it’s unlikely that U.S. demand will explode higher over the next three months.
But what about China?
As we’ve covered in the Digest, Beijing just unleashed a tsunami of stimulus for its beleaguered economy.
From Bloomberg:
China’s central bank unveiled a broad package of monetary stimulus measures to revive the world’s second-largest economy, underscoring mounting alarm within Xi Jinping’s government over slowing growth and depressed investor confidence.
People’s Bank of China governor Pan Gongsheng cut a key short-term interest rate and announced plans to reduce the amount of money banks must hold in reserve to the lowest level since at least 2018…
More stimulus was announced last Friday. Here’s Reuters:
China’s central bank on Friday lowered interest rates and injected liquidity into the banking system as Beijing assembled a last-ditch stimulus assault to pull economic growth back towards this year’s roughly 5% target.
So, can China ignite a new oil bull?
Well, it depends on who you ask – OPEC or the International Energy Agency (IEA).
These two organizations don’t play nice together. The IEA was largely founded as a reaction to OPEC about 50 years ago to represent energy consumers and protect them from OPEC’s monopolistic price gouging at the time.
Today, both OPEC and the IEA provide their own estimates of future energy demand. As you would guess, they’re usually miles apart, skewed by their own biases. History suggests eventual oil demand usually settles somewhere in the middle of their forecasts.
Today, we’re in unique territory. These forecasts aren’t just “somewhat” off. They’re in different universes as we forecast Q4 demand.
From The Wall Street Journal:
The IEA thinks an additional 900,000 barrels of oil a day will be needed by consumers in 2024. OPEC is far more bullish and expects two million extra barrels will be required
For context, other than the pandemic, when forecasting oil demand was near impossible, these two estimates have never been wider than 350,000 barrels at this point in the year. In other words, the differential is 3X the prior largest spread.
So, who will be right?
Well, which China are we going to get in the final quarter of the year? The one that’s falling into a deflationary spiral? Or the one that’s juiced on a tsunami of stimulus from Beijing?
Back to the WSJ:
OPEC thinks China will need 650,000 extra barrels a day in 2024, while the IEA has penciled in less than a third as much.
The country consumed 315,000 additional barrels in the first half of the year, but demand has been shrinking year-over-year for four consecutive months.
This suggests it would take an extraordinary economic boom for the last few months of the year to hit OPEC’s punchy target.
From this lens, while stimulus in China should put a floor under oil prices at worst, and more likely, put a bit of a lift under prices, banking on Beijing stimulus to push oil back into the $80s by New Year’s is a tough bet to make.
Now, scanning the horizon for other short-term price drivers, yes, there’s the possibility of a major supply disruption. This could come from a broader regional war in the Mideast and/or Ukraine taking out Russian pipelines and/or processing facilities. But clearly, we can’t bank on such wildcards events, making them the foundation of a trade.
So, from a shorter-term perspective, oil isn’t flashing a green light.
But from a contrarian perspective, does history suggest that this “red light” is actually a major “green light”?
How are traders currently positioned for oil?
Super bearish.
As you can see below, we’re looking at the most negative positioning in 13 years.

Meanwhile, the latest Bloomberg Markets Live Pulse (BMLP) survey named crude oil as the trade that was “best to avoid for the rest of the year.”

But counterintuitively, this suggests that higher prices are on the way – it’s just “how soon?”
The reality is that traders often feel most bullish (and bearish) at the worst possible times.
Too much optimism (or pessimism) can be a prelude to a reversal of direction. After all, when everyone is on one side of a trade and expecting the same outcome, there’s no one left to continue driving that momentum.
Last week, Brett Eversole, the editor of Daily Wealth over at our sister publication Stansberry Research, highlighted the relationship between extreme bearishness and subsequent bullish returns. He did this by comparing the Commitment of Traders (COT) report, which is a weekly recap of how futures traders are positioning their money, with ensuing returns for the S&P.
From Brett:
Futures traders are near the most bearish we’ve seen in the past 15 years. Take a look…

Futures traders are the most bearish they’ve been on oil since June 2023. And before then, we hadn’t seen this kind of sentiment since 2010.
Brett ran the numbers on oil’s price change in the 12 months following the low points (red circles) in the chart above. The conclusion was that the average 12-month gain following such depressed COT readings was 62%.
Back to Brett:
We’ve seen two rallies that each lasted more than 12 months. Those led to average gains of 96% for oil. The other three all lasted less than a year and led to average gains of 39%..
Clearly, this not just a green light for an oil trade, but a very bright green light.
How do we resolve this bullishness with our prior bearishness?
We’ll circle back to that answer shortly. First, let’s look a bit farther out.
What’s the medium/long-term case for getting into oil today?
Well, once again, the key determinant of price is the balance between supply and demand. So, what do we know about that?
We know that there’s too much supply relative to demand today, but don’t count on that lasting forever.
Here’s CNBC from earlier this year:
The oil market will face a supply shortage by the end of 2025 as the world fails to replace current crude reserves fast enough, Occidental CEO Vicki Hollub told CNBC on Monday.
About 97% of the oil produced today was discovered in the 20th century, she said. The world has replaced less than 50% of the crude produced over the last decade, Hollub added.
“We’re in a situation now where in a couple of years’ time we’re going to be very short on supply,” she told CNBC’s Tyler Mathisen…
For now, the market is oversupplied, which has held oil prices down despite the current conflict in the Middle East, Hollub said. The U.S., Brazil, Canada and Guyana have pumped record amounts of oil as demand slows amid a faltering economy in China.
But the supply and demand outlook will flip by the end of 2025, Hollub said.
Why? What’s going to flip this supply/demand imbalance?
To answer that, let’s rewind to Reuters from about a year ago:
Government policies to fight climate change are discouraging oil companies from investing heavily in new production even as they turn in record profits – a dynamic that could spell tight supply and high prices as clean energy alternatives seek to fill the void…
“If we don’t maintain some level of investment in the industry, you end up running short of supply which leads to high prices,” Exxon Mobil CEO Darren Woods said.
He said oil and gas reserves are depleting at 5-7% annually, and output will decline if companies stop investing to replace them.
Let’s get more granular to see what’s really happening.
Here’s our macro expert Eric Fry from Investment Report to fill in some key details:
The number of Drilled But Uncompleted (DUC) wells has dropped to the lowest level in more than a decade.
A DUC well is one that has been drilled, but not yet been brought into production. In other words, the well has been drilled to the target depth, but the completion process has not yet been carried out.
Because an oil company can bring DUC wells into production quickly, they provide a great way to capitalize on oil price spikes without having to make sizeable new investments. Oil companies have been doing exactly that during the last four years.
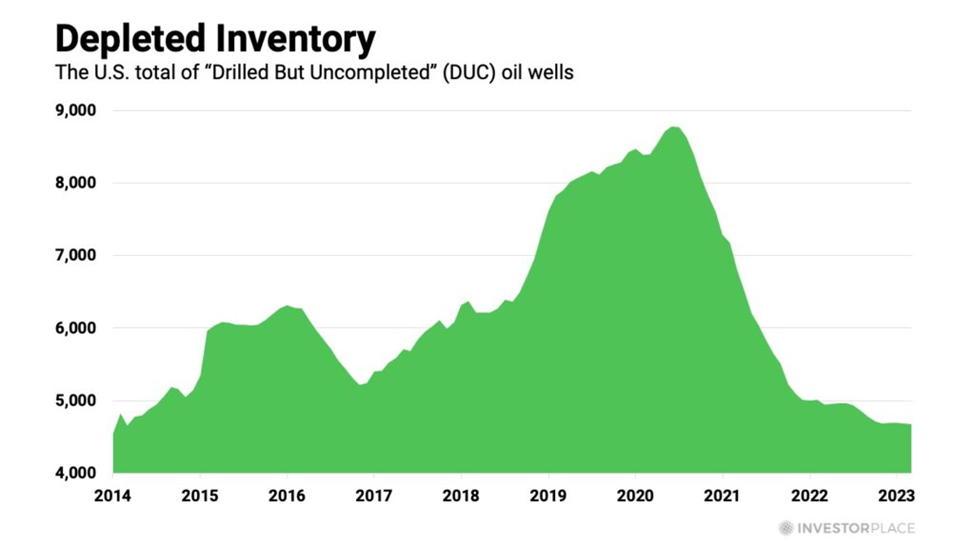
As a result, the remaining inventory of DUC wells has dropped to a 10-year low. These low inventories mean that U.S. oil companies have exhausted most of the “easy money” they could make from oil price spikes.
Going forward, therefore, they would need to boost spending on new drilling activity, but that isn’t happening.
The number of active oil-drilling rigs in the U.S. has been falling for more than a year and currently sits 26% below the 10-year average number.
In other words, there is no significant U.S. supply boost on the horizon.
Bottom line: Today’s brisk supply/demand headwind is going to flip into a vigorous tailwind in about 15ish months.
With that in mind, check out some of these Big Oil valuations…
Before I show them to you, for perspective, the S&P’s current price-to-earnings (PE) ratio is at a lofty 29.9, and its dividend yield is just 1.3%.
Now, consider these alternatives:
- Exxon: PE 13.9, dividend yield 3.4%
- Shell: PE 11.6, dividend yield 4.2%
- ConocoPhillips: PE 11.7, dividend yield 3.0%
- Diamondback Energy: PE 8.7, dividend yield 6.4%
- Equinor: PE 7.6, dividend yield 5.4%
To be clear, these stocks could trade lower in the coming months. But waiting for “the bottom” is a fool’s errand. The wiser question for a longer-term investor to ask is: “Are today’s prices likely to make me money when I look 18-24+ months out on the horizon?”
I believe the answer is a resounding “yes.”
And this brings us back to our immediate action step…
So, Big Oil appears to be trading at money-making prices from a long-term perspective. But what about the short-term? Do we get into a trade today or not?
No.
Momentum is decidedly bearish (we’re on pace to wrap up the third consecutive monthly loss tomorrow). We must respect that. After all, fighting a dominant market trend is a fantastic way to lose your shirt.
Now, the trend could change directions tomorrow. And based on the extreme COT reading, it might. But wise trading suggests we wait for more evidence of a reversal. Jumping in before then would be little more than speculative gambling.
But don’t miss the bigger picture…
The supply/demand imbalance is headed for a 180-degree reversal. Today’s bearish pessimism is paving the way for tomorrow’s bullish euphoria.
Have a good evening,
Jeff Remsburg